Revised September 2001
| EXPECTED 1999 WAGES OF SELECTED NME COUNTRIES (IN US DOLLARS) | ||
| Country | 1999 GNP Per Capita in U.S. Dollars |
Expected 1999 Wages Per Hour |
| Armenia | $490 | $0.63 |
| Azerbaijan | $460 | $0.62 |
| Belarus | $2,620 | $1.64 |
| Estonia | $3,400 | $2.01 |
| Georgia | $620 | $0.69 |
| Kazakhstan | $1,250 | $0.99 |
| Kyrgyz Republic | $300 | $0.54 |
| Lithuania | $2,640 | $1.65 |
| Moldova | $410 | $0.59 |
| People's Republic of China | $780 | $0.77 |
| Romania | $1,470 | $1.10 |
| Russian Federation | $2,250 | $1.47 |
| Tajikistan | $280 | $0.53 |
| Turkmenistan | $670 | $0.72 |
| Ukraine | $840 | $0.80 |
| Uzbekistan | $720 | $0.74 |
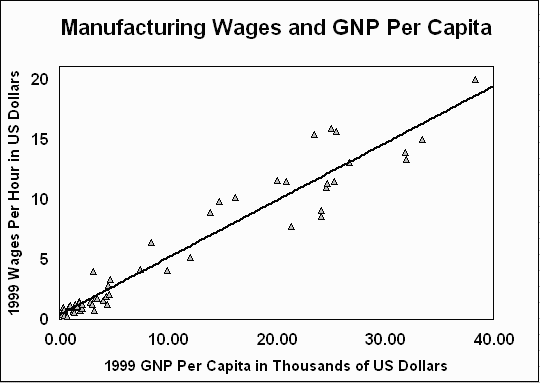
| Wage Rate = (GNP * 0.000475) + 0.39807648 | ||
| CALCULATION OF 1999 WAGES PER HOUR IN US DOLLARS | ||||||||||
| Country | Reported Wage Rate | Measuring Currency | Measuring Unit | Hours per Measuring Unit | Hourly Wages | Reporting Year | Inflator to 1999 | Inflated Hourly Wages | 1999 Exchange Rate (Per US$) |
1999 Wages per hour in US Dollars |
| Algeria | 12,323.00 | Dinars | month | 192 | 64.182 | 1996 | 1.1390 | 73.104 | 66.57 | 1.10 |
| Argentina | 4.16 | Pesos | hour | 1 | 4.160 | 1999 | 1.0000 | 4.160 | 1.00 | 4.16 |
| Australia | 17.38 | Dollars | hour | 1 | 17.380 | 1998 | 1.0266 | 17.843 | 1.55 | 11.51 |
| Austria | 28,455.00 | Schillings | month | 192 | 148.203 | 1998 | 1.0058 | 149.057 | 12.93 | 11.53 |
| Belgium | 406.79 | Francs | hour | 1 | 406.790 | 1997 | 1.0212 | 415.420 | 37.89 | 10.96 |
| Bolivia | 1,094.00 | Bolivianos | month | 192 | 5.698 | 1996 | 1.1521 | 6.565 | 5.81 | 1.13 |
| Botswana | 632.00 | Pula | month | 192 | 3.292 | 1998 | 1.0705 | 3.524 | 4.62 | 0.76 |
| Brazil | 637.10 | Reais | month | 192 | 3.318 | 1997 | 1.0816 | 3.589 | 1.82 | 1.98 |
| Bulgaria | 205.89 | Leva | month | 192 | 1.072 | 1999 | 1.0000 | 1.072 | 1.84 | 0.58 |
| Canada | 17.20 | dollars | hour | 1 | 17.200 | 1999 | 1.0000 | 17.200 | 1.49 | 11.58 |
| Chile | 203,540.00 | Pesos | month | 192 | 1,060.104 | 1999 | 1.0000 | 1,060.104 | 508.78 | 2.08 |
| Colombia | 427,313.00 | Pesos | month | 192 | 2,225.589 | 1999 | 1.0000 | 2,225.589 | 1,756.23 | 1.27 |
| Costa Rica | 97,774.50 | Colones | month | 192 | 509.242 | 1999 | 1.0000 | 509.242 | 285.68 | 1.78 |
| Croatia | 3,869.00 | Kunas | month | 192 | 20.151 | 1999 | 1.0000 | 20.151 | 7.11 | 2.83 |
| Dominican Republic | 21.60 | Pesos | hour | 1 | 21.600 | 1997 | 1.1131 | 24.042 | 16.03 | 1.50 |
| Ecuador | 4,380.40 | Sucres | hour | 1 | 4,380.400 | 1997 | 2.0720 | 9,076.189 | 11,786.80 | 0.77 |
| Egypt | 103.00 | Pounds | week | 44 | 2.341 | 1997 | 1.0740 | 2.514 | 3.41 | 0.74 |
| El Salvador | 1,823.34 | Colones | month | 192 | 9.497 | 1998 | 1.0051 | 9.545 | 6.40 | 1.49 |
| Finland | 12,054.00 | Markkaa | Month | 192 | 62.781 | 1998 | 1.0116 | 63.511 | 5.59 | 11.37 |
| France | 55.40 | Francs | hour | 1 | 55.400 | 1997 | 1.0126 | 56.098 | 6.16 | 9.10 |
| Germany | 27.53 | Mark | hour | 1 | 27.530 | 1999 | 1.0000 | 27.530 | 1.76 | 15.64 |
| Greece | 1,539.76 | Drachmas | hour | 1 | 1,539.760 | 1998 | 1.0268 | 1,580.958 | 305.65 | 5.17 |
| Guatemala | 1,602.25 | Quetzales | month | 192 | 8.345 | 1999 | 1.0000 | 8.345 | 7.39 | 1.13 |
| India | 1,137.30 | Rupees | month | 192 | 5.923 | 1997 | 1.1849 | 7.019 | 43.06 | 0.16 |
| Ireland | 7.18 | Pounds | hour | 1 | 7.180 | 1998 | 1.0161 | 7.295 | 0.94 | 7.78 |
| Israel | 42.00 | New Shekels | hour | 1 | 42.000 | 1999 | 1.0000 | 42.000 | 4.14 | 10.15 |
| Japan | 291,100.00 | Yen | month | 192 | 1,516.146 | 1999 | 1.0000 | 1,516.146 | 113.91 | 13.31 |
| Jordan | 5.89 | Dinars | day | 8 | 0.736 | 1998 | 1.0061 | 0.741 | 0.71 | 1.04 |
| Kenya | 5,510.80 | Shillings | month | 192 | 28.702 | 1997 | 1.0861 | 31.174 | 70.33 | 0.44 |
| Korea | 1,475,500.00 | Won | month | 192 | 7,684.896 | 1999 | 1.0000 | 7,684.896 | 1,188.82 | 6.46 |
| Malaysia | 1,210.00 | Ringgit | month | 192 | 6.302 | 1997 | 1.0527 | 6.634 | 3.80 | 1.75 |
| Mauritius | 165.96 | Rupees | day | 8 | 20.745 | 1999 | 1.0000 | 20.745 | 25.19 | 0.82 |
| Mexico | 2,377.70 | Pesos | month | 192 | 12.384 | 1999 | 1.0000 | 12.384 | 9.56 | 1.30 |
| Netherlands | 32.02 | Guilders | hour | 1 | 32.020 | 1998 | 1.0296 | 32.968 | 2.07 | 15.93 |
| New Zealand | 16.90 | Dollars | hour | 1 | 16.900 | 1999 | 1.0000 | 16.900 | 1.89 | 8.95 |
| Nicaragua | 12.00 | Cordobas | hour | 1 | 12.000 | 1999 | 1.0000 | 12.000 | 11.81 | 1.02 |
| Norway | 22,441.00 | Kroner | month | 192 | 116.880 | 1999 | 1.0000 | 116.880 | 7.80 | 14.99 |
| Pakistan | 3,211.54 | Rupees | month | 192 | 16.727 | 1997 | 1.1066 | 18.510 | 49.12 | 0.38 |
| Panama | 250.90 | Balboas | month | 192 | 1.307 | 1999 | 1.0000 | 1.307 | 1.00 | 1.31 |
| Paraguay | 480,081.00 | Guaranies | month | 192 | 2,500.422 | 1994 | 1.5862 | 3,966.089 | 3,119.10 | 1.27 |
| Peru | 25.56 | Nuevos Soles | day | 8 | 3.195 | 1999 | 1.0000 | 3.195 | 3.38 | 0.94 |
| Philippines | 6,654.00 | Pesos | month | 192 | 34.656 | 1995 | 1.3510 | 46.821 | 39.09 | 1.20 |
| Poland | 1,203.90 | New Zlotys | month | 192 | 6.270 | 1998 | 1.0161 | 6.371 | 3.97 | 1.61 |
| Singapore | 2,803.00 | Dollars | month | 192 | 14.599 | 1999 | 1.0000 | 14.599 | 1.70 | 8.61 |
| Slovenia | 144,110.00 | Tolars | month | 192 | 750.573 | 1999 | 1.0000 | 750.573 | 181.77 | 4.13 |
| South Africa | 4,464.96 | Rand | month | 192 | 23.255 | 1998 | 1.0514 | 24.449 | 6.11 | 4.00 |
| Spain | 1,463.00 | Pesetas | hour | 1 | 1,463.000 | 1999 | 1.0000 | 1,463.000 | 148.60 | 9.84 |
| Sri Lanka | 22.03 | Rupees | hour | 1 | 22.030 | 1999 | 1.0000 | 22.030 | 70.64 | 0.31 |
| Sweden | 105.07 | Kronor | hour | 1 | 105.070 | 1998 | 1.0261 | 107.811 | 8.26 | 13.05 |
| Switzerland | 5,717.00 | Francs | month | 192 | 29.776 | 1998 | 1.0079 | 30.011 | 1.50 | 19.98 |
| Thailand | 5,921.00 | Baht | month | 192 | 30.839 | 1999 | 1.0000 | 30.839 | 37.81 | 0.82 |
| Trinidad and Tobago | 908.73 | Dollars | week | 44 | 20.653 | 1998 | 1.0345 | 21.364 | 6.30 | 3.39 |
| Turkey | 1,640,856.00 | Liras | day | 8 | 205,107.000 | 1997 | 3.0439 | 624,321.218 | 418,783.00 | 1.49 |
| United Kingdom | 9.49 | Pounds | hour | 1 | 9.490 | 1999 | 1.0000 | 9.490 | 0.62 | 15.36 |
| Zimbabwe | 2,951.51 | Dollars | month | 192 | 15.372 | 1997 | 2.0895 | 32.120 | 38.31 | 0.84 |
| (United States) | 13.91 | Dollars | hour | 1 | 13.910 | 1999 | 1.0000 | 13.910 | 1.00 | 13.91 |
| WAGES AND GNP IN US DOLLARS (IN GNP ORDER) | ||
| Country | 1999 GNP Per Capita in US$ |
1999 Hourly Wage in US$ |
| Kenya | 360.00 | 0.443 |
| Mauritius | 390.00 | 0.824 |
| Nicaragua | 410.00 | 1.016 |
| India | 440.00 | 0.163 |
| Pakistan | 470.00 | 0.377 |
| Zimbabwe | 530.00 | 0.838 |
| Sri Lanka | 820.00 | 0.312 |
| Bolivia | 990.00 | 1.129 |
| Philippines | 1,050.00 | 1.198 |
| Ecuador | 1,360.00 | 0.770 |
| Egypt | 1,380.00 | 0.738 |
| Bulgaria | 1,410.00 | 0.584 |
| Algeria | 1,550.00 | 1.098 |
| Paraguay | 1,560.00 | 1.272 |
| Jordan | 1,630.00 | 1.045 |
| Guatemala | 1,680.00 | 1.130 |
| Dominican Republic | 1,920.00 | 1.500 |
| El Salvador | 1,920.00 | 1.491 |
| Thailand | 2,010.00 | 0.816 |
| Peru | 2,130.00 | 0.944 |
| Colombia | 2,170.00 | 1.267 |
| Turkey | 2,900.00 | 1.491 |
| Panama | 3,080.00 | 1.307 |
| South Africa | 3,170.00 | 4.002 |
| Botswana | 3,240.00 | 0.762 |
| Malaysia | 3,390.00 | 1.746 |
| Costa Rica | 3,570.00 | 1.783 |
| Poland | 4,070.00 | 1.606 |
| Brazil | 4,350.00 | 1.977 |
| Mexico | 4,440.00 | 1.295 |
| Croatia | 4,530.00 | 2.833 |
| Chile | 4,630.00 | 2.084 |
| Trinidad and Tobago | 4,750.00 | 3.392 |
| Argentina | 7,550.00 | 4.162 |
| Korea | 8,490.00 | 6.464 |
| Slovenia | 10,000.00 | 4.129 |
| Greece | 12,110.00 | 5.172 |
| New Zealand | 13,990.00 | 8.949 |
| Spain | 14,800.00 | 9.845 |
| Israel | 16,310.00 | 10.146 |
| Canada | 20,140.00 | 11.577 |
| Australia | 20,950.00 | 11.514 |
| Ireland | 21,470.00 | 7.783 |
| United Kingdom | 23,590.00 | 15.357 |
| Singapore | 24,150.00 | 8.613 |
| France | 24,170.00 | 9.104 |
| Belgium | 24,650.00 | 10.963 |
| Finland | 24,730.00 | 11.371 |
| Netherlands | 25,140.00 | 15.926 |
| Austria | 25,430.00 | 11.532 |
| Germany | 25,620.00 | 15.639 |
| Sweden | 26,750.00 | 13.048 |
| United States | 31,910.00 | 13.910 |
| Japan | 32,030.00 | 13.310 |
| Norway | 33,470.00 | 14.986 |
| Switzerland | 38,380.00 | 19.978 |
|
|||||||||||||||||||||||||||||||||
|
Notes: General: The selection of countries was based upon the availability of wage data for 1994 or later as reported in the Yearbook of Labour Statistics 2000, International Labour Organization (ILO), (Geneva: 2000), GNP data as reported in World Development Indicators, World Bank, 2000/2001, and exchange rate information. Wages: Wage rates were reported in the Yearbook of Labour Statistics 2000, ILO, (Geneva: 2000), Chapter 5B: Wages in Manufacturing. The years of the reported wage rates range from 1994 to 1999. Reported wages prior to 1994 were excluded from the analysis and all calculations. Wages reported by ILO in most cases are based on cash payments received from employers on a regular basis. In addition to remuneration for normal working hours, cost-of-living allowances and other regularly paid allowances are included in wages. Wages do not include remuneration for overtime, bonuses and gratuities, family allowances, or other social security payments made by the employer. See Yearbook of Labour Statistics 2000 for further discussion of wage data. Where monthly or daily wages were given, hourly wages were calculated assuming 24 working days per month, 5.5 working days per week, 8 working hours per day. Inflator: Wages were inflated, where the base year was not 1999, using the consumer price index (or wage rate index) data reported in International Financial Statistics, International Monetary Fund, May 2001. The inflator rate was calculated by dividing the consumer price index for 1999 by the consumer price index for the year the wage rate was reported. Exchange rates: In most cases, exchange rates were expressed as foreign currency per one U.S. dollar. All of the exchange rates used, except for certain European countries (i.e., Austria, Belgium, Finland, France, Germany, Italy, the Netherlands, and Spain), were as reported in International Financial Statistics, International Monetary Fund, May 2001. For these European countries, the Department relied on the exchange rate information it regularly obtains from Dow Jones B.I.S. and the Federal Reserve for the purpose of determining the daily exchange rates that are then posted to the Import Administration web site. The exchange rates used in the present analysis are a market average for the entire year. National Income: GNP, as reported in Selected World Development Indicators 2001, World Bank, 2001. See Selected World Development Indicators 2001 for further information. Analysis: Regression analysis is ordinary least squares analysis. |