|
NON-MARKET ECONOMY COUNTRIES 1997 INCOME DATA Revised May 1999 |
| EXPECTED 1997 WAGES OF SELECTED NME COUNTRIES (IN US DOLLARS) |
1997 GDP Expected 1997
Country Per Capita Wages Per Hour
|
| REPORTED WAGES BY COUNTRY |
Wage Measuring Measuring Reporting
Country Rate Currency Unit Year
|
| CALCULATION OF 1997 GDP PER CAPITA IN US DOLLARS |
1997 GDP in 1997 1997 GDP
Country millions of Population Per Capita
US dollars in thousands in US dollars
|
| CALCULATION OF 1997 WAGES PER HOUR IN US DOLLARS |
                                                               Inflator    1997                 Inflated    1997 Wages
Country             Wage  Measuring Measuring Reporting           to     Exchange    Hourly      Hourly     Per Hour in
                    Rate  Currency     Unit      Year   Hours    1997      Rate      Wages        Wages     US dollars

Argentina           4.03    pesos      hour     1997        1   1.0000    0.9995      4.03       4.03        4.03
Australia          16.34   dollar      hour     1996        1   0.9974    1.3439     16.34      16.30       12.13
Austria         32173.00  schilling   month     1995      192   1.0100    12.204    167.57     169.24       13.87
Bahrain              200    dinar     month     1997      192   1.0000    0.3760      1.04       1.04        2.77
Bangladesh         59.87    taka       day      1992        8   1.2066    43.892      7.48       9.03        0.21
Botswana             633    pula      month     1997      192   1.0000    3.6508      3.30       3.30        0.90
Canada              16.8   dollar      hour     1997        1   1.0000    1.3846     16.80      16.80       12.13
Chile             189753    peso      month     1997      192   1.0000     419.3    988.30     988.30        2.36
Colombia          326421    peso      month     1995      192   1.5105   1140.96   1700.11    2568.05        2.25
Costa Rica         75672   colone     month     1997      192   1.0000     232.6    394.13     394.13        1.69
Croatia             2196    kuna      month     1997      192   1.0000     6.101     11.44      11.44        1.87
Denmark           158.69   kroner      hour     1996        1   1.0211     6.604    158.69     162.05       24.54
Dominican Republ    21.6    peso       hour     1997        1   1.0000    14.265     21.60      21.60        1.51
Ecuador           3226.7    sucre      hour     1996        1   1.3051    3998.3   3226.70    4211.08        1.05
Egypt                 84    pound      week     1995       44   1.1215     3.388      1.91       2.14        0.63
El Salvador          7.5   colone      hour     1996        1   1.0452     8.755      7.50       7.84        0.90
Fiji               98.04   dollar      week     1996       44   1.0337    1.4437      2.23       2.30        1.60
Finland            11004   markaa     month     1995      192   1.0189    5.1914     57.31      58.39       11.25
France             50.63    franc      hour     1993        1   1.0313    5.8367     50.63      52.22        8.95
Germany             18.6    mark       hour     1997        1   1.0000    1.7341     18.60      18.60       10.73
Greece            1470.5   drachma     hour     1997        1   1.0000    273.06   1470.50    1470.50        5.39
Guatemala        1430.04  quetzale    month     1997      192   1.0000    6.0653      7.45       7.45        1.23
India               1211    rupee     month     1995      192   1.0894    36.313      6.31       6.87        0.19
Ireland             6.87    pound      hour     1997        1   1.0000    0.6588      6.87       6.87       10.43
Israel                35 new shekel    hour     1997        1   1.0000    3.4494     35.00      35.00       10.15
Jamaica           894.98   dollar      week     1992       44   1.2640    35.404     20.34      25.71        0.73
Japan             287200     yen      month     1997      192   1.0000    120.99   1495.83    1495.83       12.36
Jordan              5.27    dinar      day      1995        8   1.0305    0.7090      0.66       0.68        0.96
Kenya             5510.8  shilling    month     1997      192   1.0000    58.732     28.70      28.70        0.49
Korea (Rep. of)  1326200     won      month     1997      192   1.0000    951.29   6907.29    6907.29        7.26
Luxemborg            484    franc      hour     1996        1   1.0137    35.774    484.00     490.65       13.72
Malaysia            1002   ringgit    month     1995      192   1.0631    2.8133      5.22       5.55        1.97
Malta               58.1    pound      week     1995       44   1.0587    0.3857      1.32       1.40        3.62
Mauritius         148.74    rupee      day      1997        8   1.0000    20.561     18.59      18.59        0.90
Mexico            1554.2 nuevos peso  month     1997      192   1.0000    7.9141      8.09       8.09        1.02
Netherlands        28.85   guilder     hour     1995        1   1.0428    1.9513     28.85      30.09       15.42
New Zealand        15.78   dollar      hour     1997        1   1.0000    1.5083     15.78      15.78       10.46
Norway            106.09   kroner      hour     1997        1   1.0000    7.0734    106.09     106.09       15.00
Pakistan            1956    rupee     month     1994      192   1.3807    41.112     10.19      14.07        0.34
Panama               628   balboas    month     1994      192   1.0353         1      3.27       3.39        3.39
Paraguay          480081  guaranies   month     1994      192   1.3320      2191   2500.42    3330.63        1.52
Philippines         6654    peso      month     1995      192   1.1390    29.471     34.66      39.47        1.34
Poland             859.4  new zloty   month     1996      192   1.1592    3.2793      4.48       5.19        1.58
Portugal             539   escudos     hour     1997        1   1.0000    175.31    539.00     539.00        3.07
Seychelles          2513    rupee     month     1995      192   0.9945    5.0263     13.09      13.02        2.59
Singapore         2486.7   dollar     month     1997      192   1.0000    1.4848     12.95      12.95        8.72
Slovenia          118960    tolar     month     1997      192   1.0000    159.69    619.58     619.58        3.88
South Africa        2446    rand      month     1993      192   1.3799    4.6080     12.74      17.58        3.81
Spain               1372   peseta      hour     1997        1   1.0000    146.41   1372.00    1372.00        9.37
Sri Lanka          18.15    rupee      hour     1997        1   1.0000    58.995     18.15      18.15        0.31
Sweden            115.01   kronor      hour     1995        1   1.0081    7.6349    115.01     115.95       15.19
Switzerland         5565    franc     month     1996      192   1.0051    1.4513     28.98      29.13       20.07
Thailand            5935    baht      month     1997      192   1.0000    31.364     30.91      30.91        0.99
Tonga               51.3   paanga      week     1992       44   1.0879    1.2635      1.17       1.27        1.00
Trinidad and Tob  904.09   dollar      week     1995       44   1.0343    6.2503     20.55      21.25        3.40
Turkey            757277    lira       day      1996        8   1.8573    151865  94659.63  175812.93        1.16
United Kingdom      8.53    pound      hour     1997        1   1.0000    0.6106      8.53       8.53       13.97
United States      13.17   dollar      hour     1997        1   1.0000         1     13.17      13.17       13.17
|
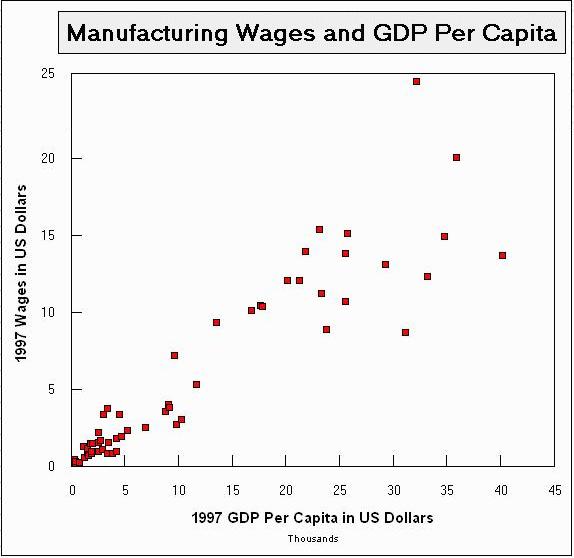
| WAGES AND GDP IN US DOLLARS (IN GDP ORDER) |
                         1997 Wages  1997 GDP
Country                   Per Hour  Per Capita

Bangladesh                 0.21        335
Kenya                      0.49        365
India                      0.19        374
Pakistan                   0.34        449
Sri Lanka                  0.31        816
Philippines                1.34      1,119
Egypt                      0.63      1,253
Ecuador                    1.05      1,520
Jordan                     0.96      1,583
Guatemala                  1.23      1,584
Jamaica                    0.73      1,609
Dominican Republic         1.51      1,855
El Salvador                0.90      1,890
Tonga                      1.00      1,908
Paraguay                   1.52      2,002
Colombia                   2.25      2,516
Thailand                   0.99      2,542
Fiji                       1.60      2,578
Costa Rica                 1.69      2,714
Turkey                     1.16      2,980
Panama                     3.39      3,034
Botswana                   0.90      3,358
South Africa               3.81      3,371
Poland                     1.58      3,510
Mauritius                  0.90      3,841
Croatia                    1.87      4,246
Mexico                     1.02      4,250
Trinidad and Tobago        3.40      4,510
Malaysia                   1.97      4,688
Chile                      2.36      5,275
Seychelles                 2.59      6,910
Malta                      3.62      8,838
Argentina                  4.03      9,111
Slovenia                   3.88      9,142
Korea (Rep. of)            7.26      9,620
Bahrain                    2.77      9,850
Portugal                   3.07     10,275
Greece                     5.39     11,700
Spain                      9.37     13,541
Israel                    10.15     16,812
New Zealand               10.46     17,651
Ireland                   10.43     17,821
Canada                    12.13     20,145
Australia                 12.13     21,323
United Kingdom            13.97     21,864
Netherlands               15.42     23,117
Finland                   11.25     23,320
France                     8.95     23,758
Austria                   13.87     25,548
Germany                   10.73     25,552
Sweden                    15.19     25,741
United States             13.17     29,278
Singapore                  8.72     31,161
Denmark                   24.54     32,153
Japan                     12.36     33,234
Norway                    15.00     34,840
Switzerland               20.07     35,894
Luxemborg                 13.72     40,211
|
|
 Regression Output:
Constant 0.371522
Std Err of Y Est 2.24661
R Squared 0.858094
No. of Observations 58
Degrees of Freedom 56
X Coefficient(s) 0.000475
Std Err of Coef. 0.000026
Equation: Wages = GDP * 0.0004754 + 0.3715219
                           Regression Output:
                  Constant                   0.371522
                  Std Err of Y Est            2.24661
                  R Squared                  0.858094
                  No. of Observations              58
                  Degrees of Freedom               56

                  X Coefficient(s)  0.000475
                  Std Err of Coef.  0.000026

                  Equation:  Wages = GDP * 0.0004754 + 0.3715219
| NOTES |
|
General: Countries selected were countries for which wage data for 1992 or later was reported in 1998 Yearbook of Labour Statistics, International Labour Office ("ILO"), (Geneva: 1998), and for which GDP data was reported in World Development Indicators, World Bank, 1999, and for which we were able to locate exchange rate information. Wages: Wage rates as reported in 1998 Yearbook of Labour Statistics, International Labour Office ("ILO"), (Geneva: 1998), Chapter 5: Wages in Manufacturing. The years of the reported wage rates range from 1992 to 1997. Wages reported by ILO in most cases are based on cash payments received from employers. In addition to remuneration for normal working hours, this includes such items as remuneration for overtime, bonuses, holiday pay, incentive pay, pay for piecework, and cost-of-living allowances. See 1998 Yearbook of Labour Statistics for further discussion of wage data. Where monthly or daily wages were given, hourly wages were calculated assuming 24 working days per month, 5.5 working days per week, 8 working hours per day. Inflator: Wages were inflated, where the base year was not 1997, using the CPI data reported in International Financial Statistics, International Monetary Fund, May 1998. Inflator rate was calculated by dividing Consumer Price Index for 1997 by the Consumer Price Index for the year the wage rate was reported. Exchange rates: Exchange rate is expressed as foreign currency per one U.S. dollar. Rates as reported in International Financial Statistics, International Monetary Fund, May 1998. Rates are market average for the entire year. National Income: To calculate the per capita GDP, we divided 1997 GDP by 1997 population (mid-year), as reported in Selected World Development Indicators 1999, World Bank, 1999. See Selected World Development Indicators 1999 for further information. Analysis: Regression analysis is ordinary least squares analysis. |